Country by country analysis of what wines are being bought for UK wine lists by Wine Business Solutions
The main overall pattern from our Wine On-Premise UK 2015 report shows that when it comes to the two largest supplier countries, France and Italy, then France is contracting rapidly, whilst Italy steadily builds.
Critically however, France is seeking out higher value opportunity, whilst Italy is driving prices down. So France continues to evolve to a better overall business model whilst many of its competitors do not. Much of the recent press about France losing the volume war to Spain and Italy is in fact a very positive thing for France, especially in the on-trade.
Spain and Argentina were red hot in our 2014 report, but both lost one quarter of their listings in 2015. Spanish tapas and Argentinian asado has been replaced by Texas barbecue as the hippest thing in UK restaurants and wine has followed. Spain always seems to tether its fortunes to fashion rather than making their key drink categories indispensable, as the French have done with Champagne and the Italians with Pinot Grigio and Prosecco.
Country by country share of wine lists
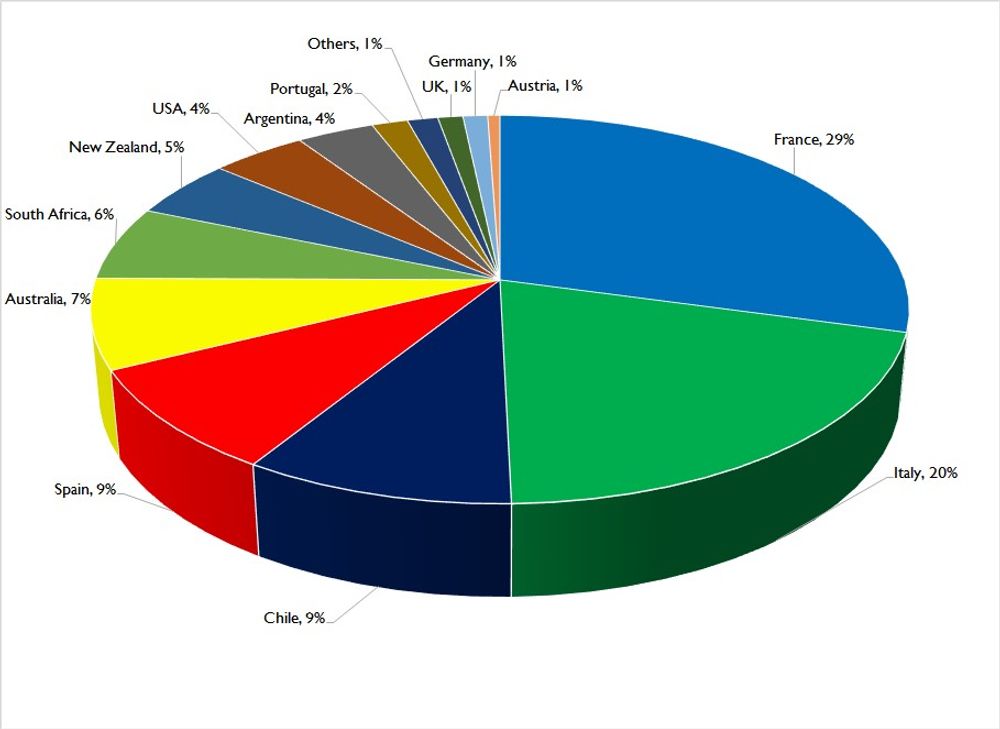
Wine Business Solutions’ guide to which countries are doing the best on UK wine lists
Here we can see that France now has a 29% share of UK wine lists, followed by Italy’s 20%. You then have to come down in to single digits to find the best performing countries which is shared between Spain and Chile at 9%.
Chile, in particular, has made itself such a fixture on lists as it offers such value for money. So much so that it has increased its share of total listings by 19% to become a serious threat to Spain. Chile, however, is driving its average price per bottle listed down below £20 which may not be such a smart strategy, unless the Chileans are absolutely certain that they can achieve / maintain world’s lowest cost of production.
Australia has grown its share of listings by 8% whilst maintaining price. A significant drop in the value of the Australian dollar is also good news for Australian producers as it means more margins heading back their way. But then they needed to be. Of greatest concern is the lack, still, of quality regional producers on UK wine lists.
South African producers should be pleased that they, like Chile, also grew their listings by 19% but at a £5 per bottle premium to Chile. This reflects that South Africa’s offer is also about quality, estate producers, where Chile’s is mainly about price fighting brands.
New Zealand went backwards for the first time in the history of WBS’ report. This was only by 1% but with great brands like Cloudy Bay finally seeming to have gone ‘over the hump’, some very smart decisions about how to evolve need to be made right now in order to avoid what has happened to New Zealand in the Australian market.
The hottest wine idea in the market is America. It doubled listings in the last year. South Africa could have done it. Australia should have. Both failed to make their cuisines ‘sexy’ in the way that the Americans have. There is not a hipster restaurant on the planet, or even a fast food joint it seems, without a pork slider bun or some slow cooked, dry rubbed brisket on the menu.
Proportion of wines per price point 2015 vs 2014
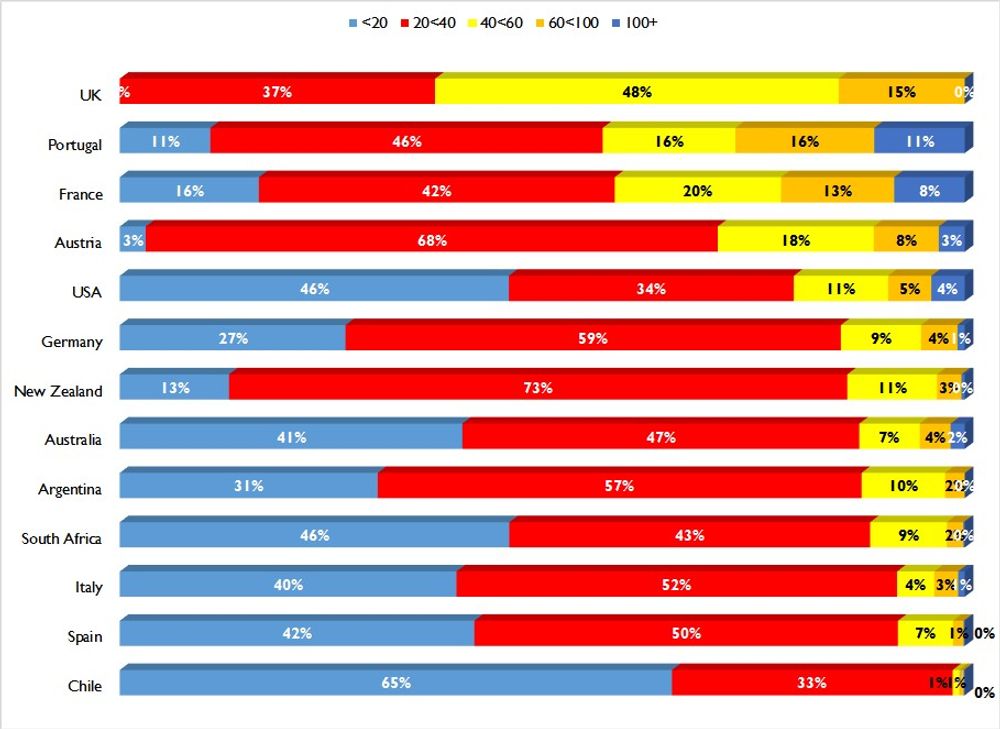
The UK is showing how to keep prices on wine lists
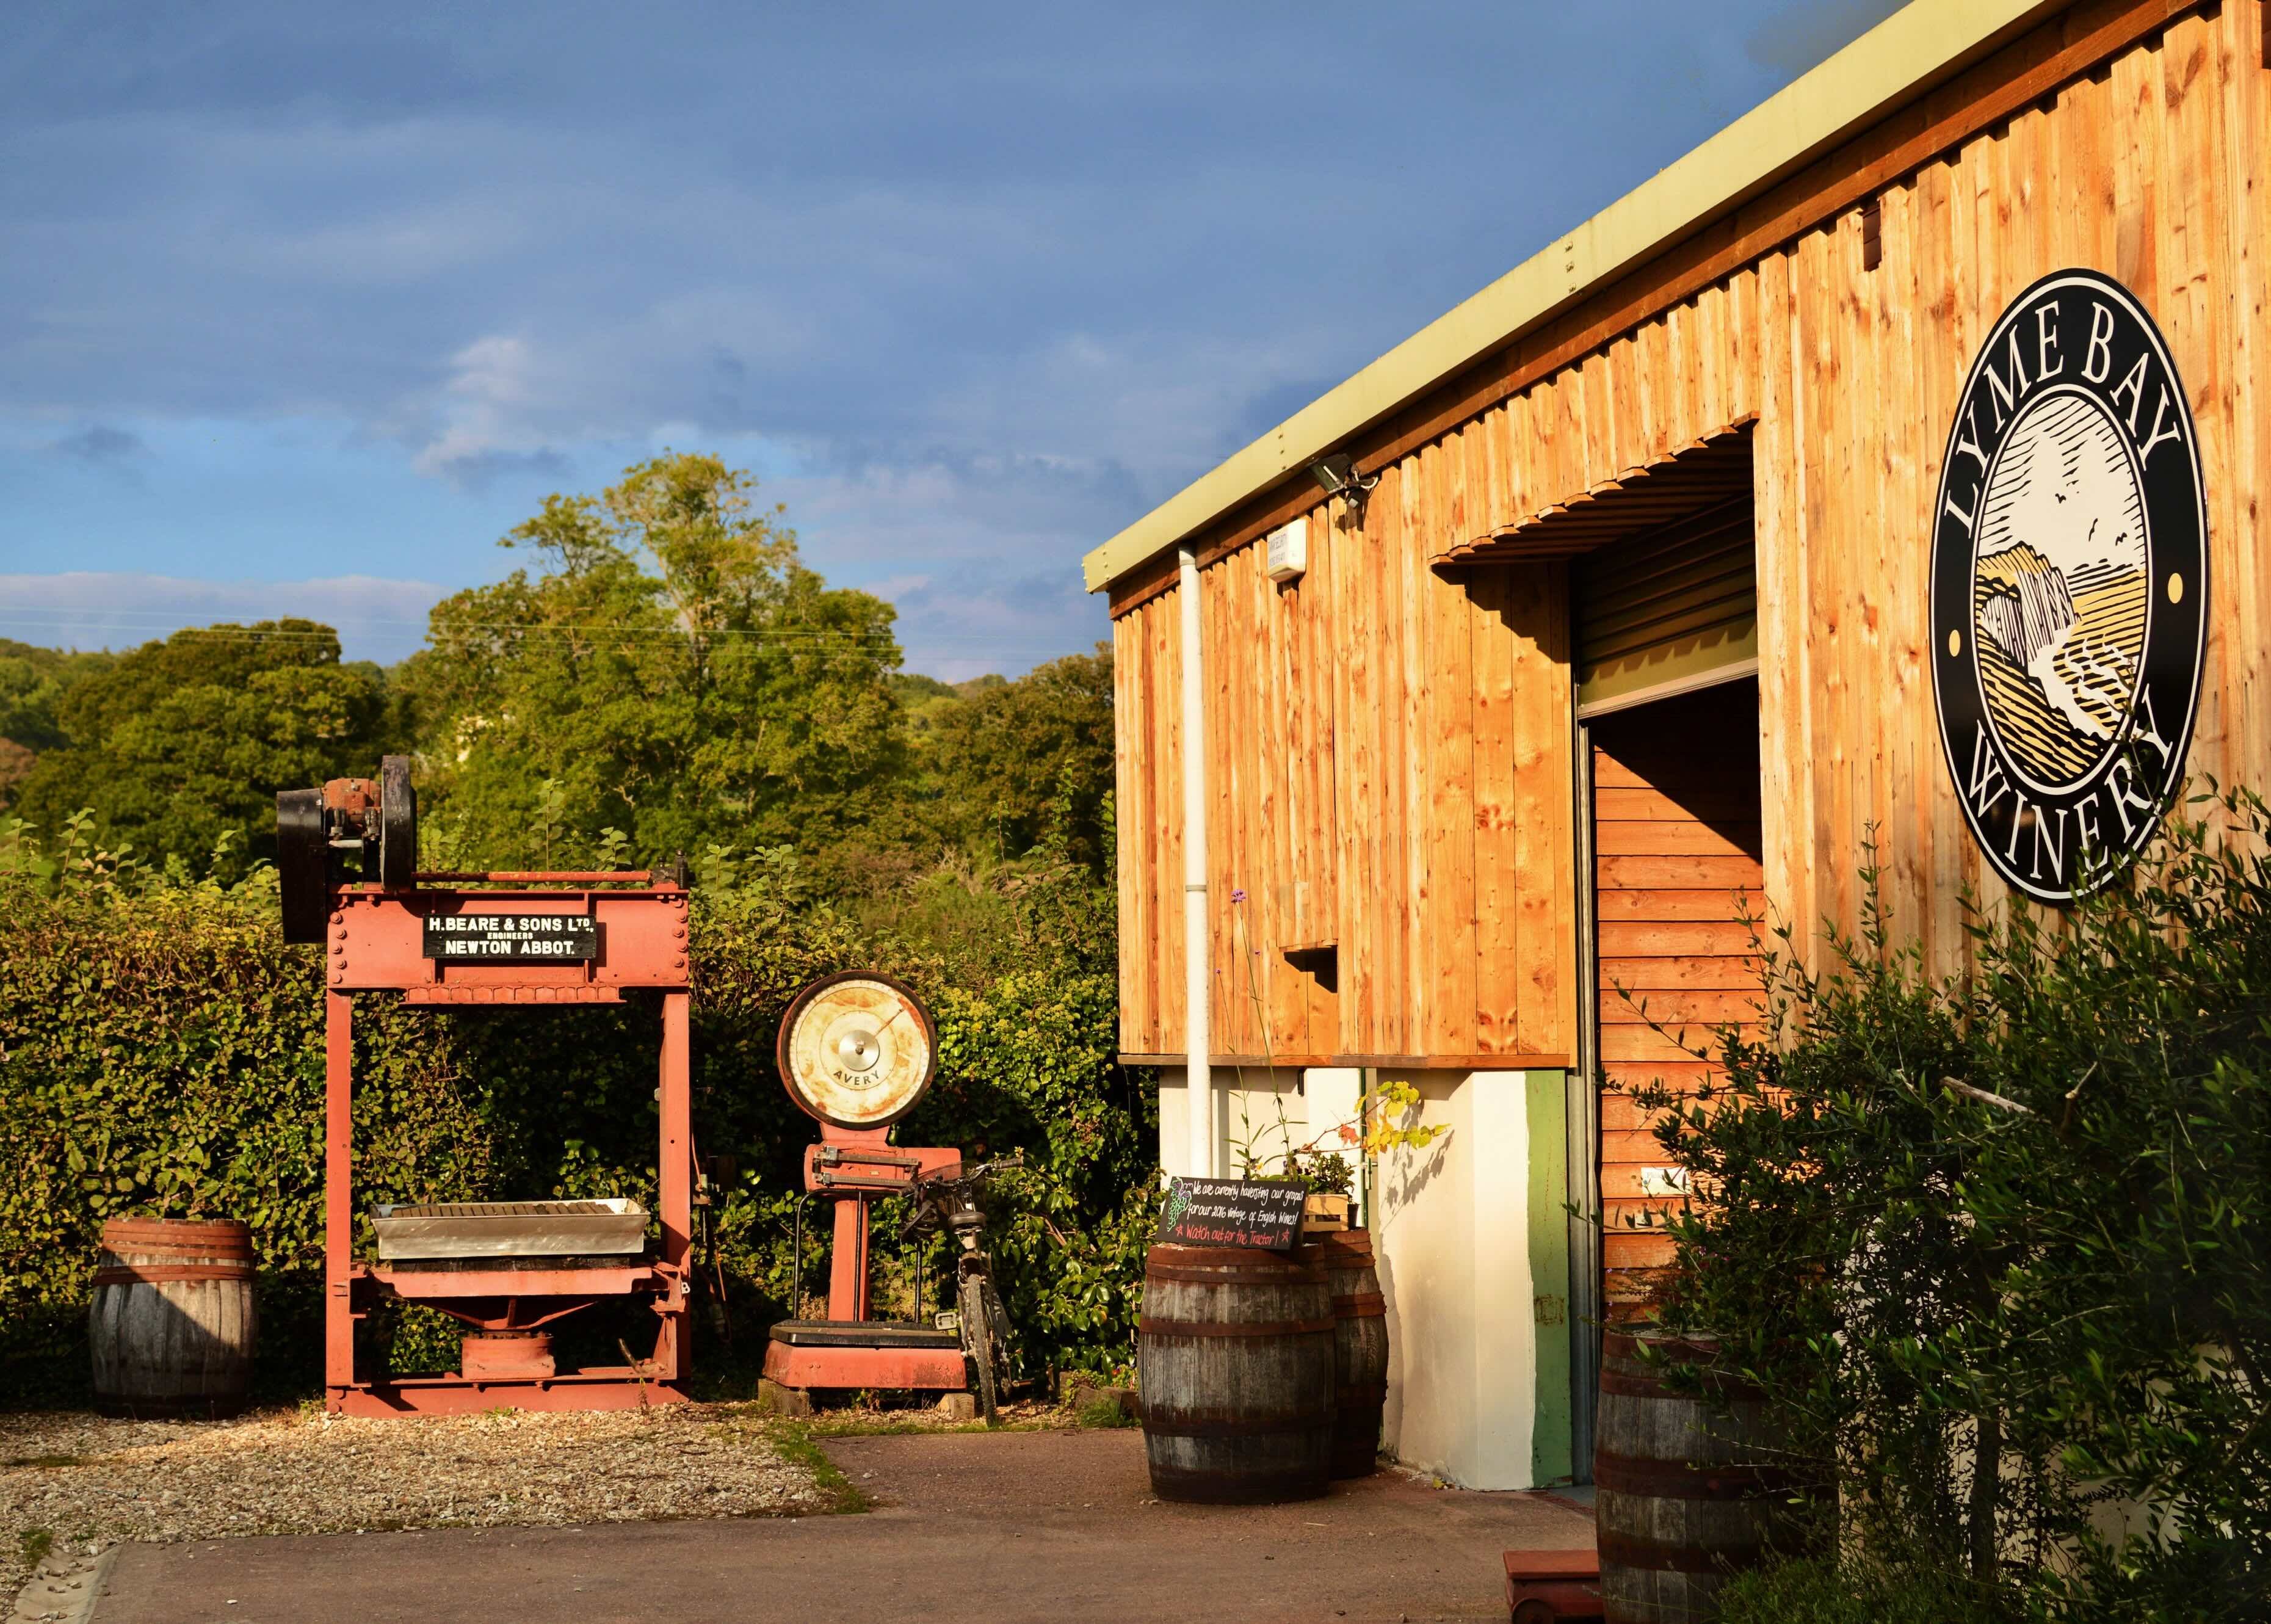
If price correlates with image then the English wine industry is doing it better than anyone. Some 63% of its listings are at more than £40 per bottle. Portugal looks good but that is largely due to the disappearance of their table wine, enabling Port to push up the average. There was significant interest in Portuguese table wines two to three years ago but not so much now.
Austria remains one of the best positioned country brands but is struggling to grow its share of listings. Germany, on the other hand, doubled its listings again in the last year. Fear of Liebfraumilch seems well in the rear-vision mirror now in the UK.
The US wine boom is not just about cheap and gimmicky brands. All of the US premium offer is being dragged along behind the ‘hipster revolution’ and there is now an unprecedented number of listings from Oregon, Washington, Napa etc.
New Zealand, as always, does well in avoiding the bottom of the market but now needs to grow the top, in order to stay with a market that continues to become more sophisticated.
Italy and Spain have both slipped below South Africa in the last year, in terms of proportion of listings over £40, undoing a lot of the great work undertaken by their respective leading brand builders.”
Price comparisons by country 2014 to 2015
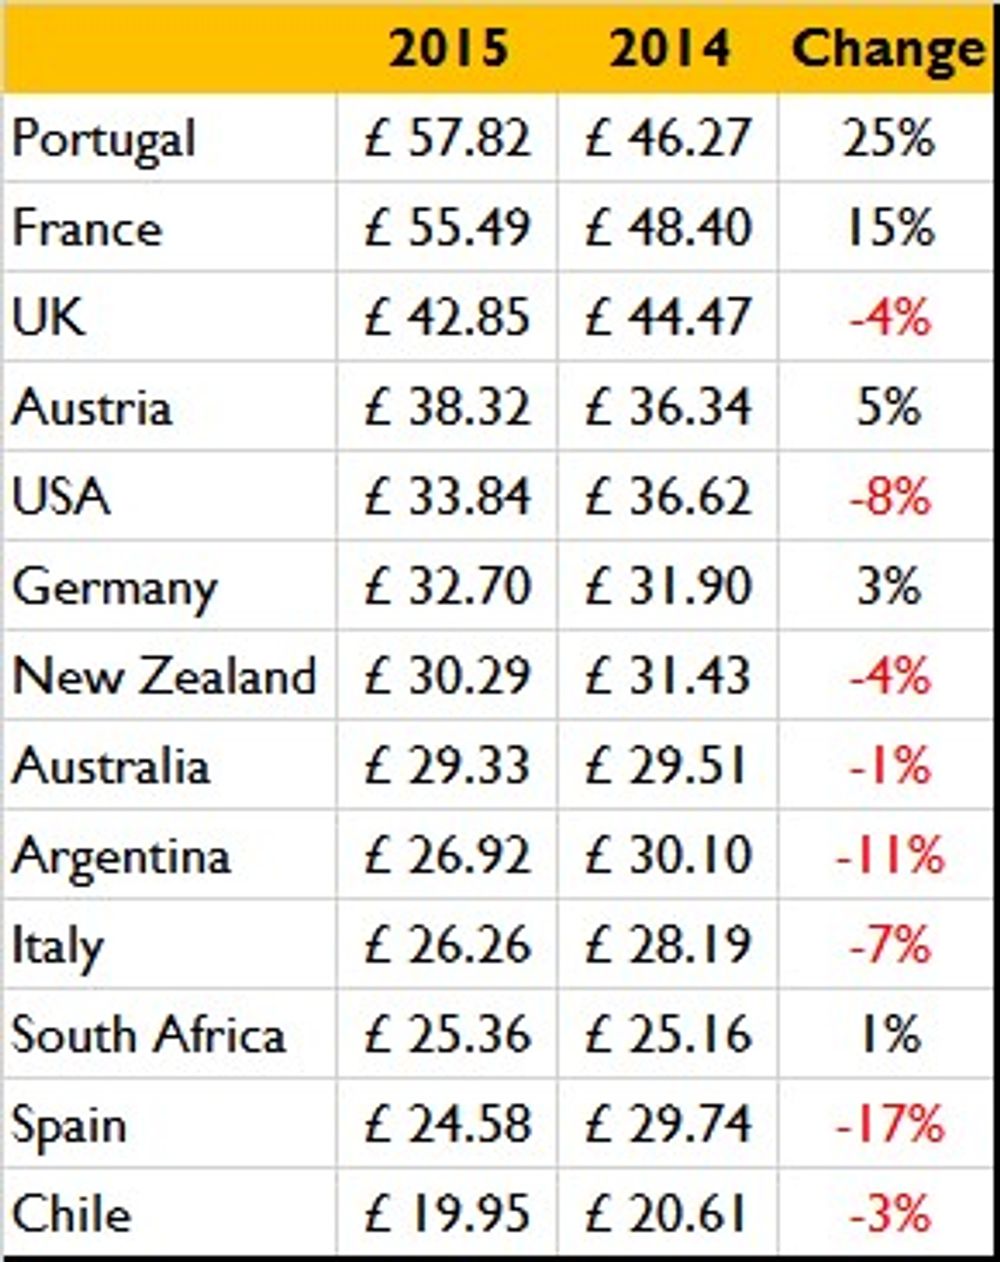
How average prices compare between 2014 and 2015
Country by country share of UK wine lists between 2011 and 2015
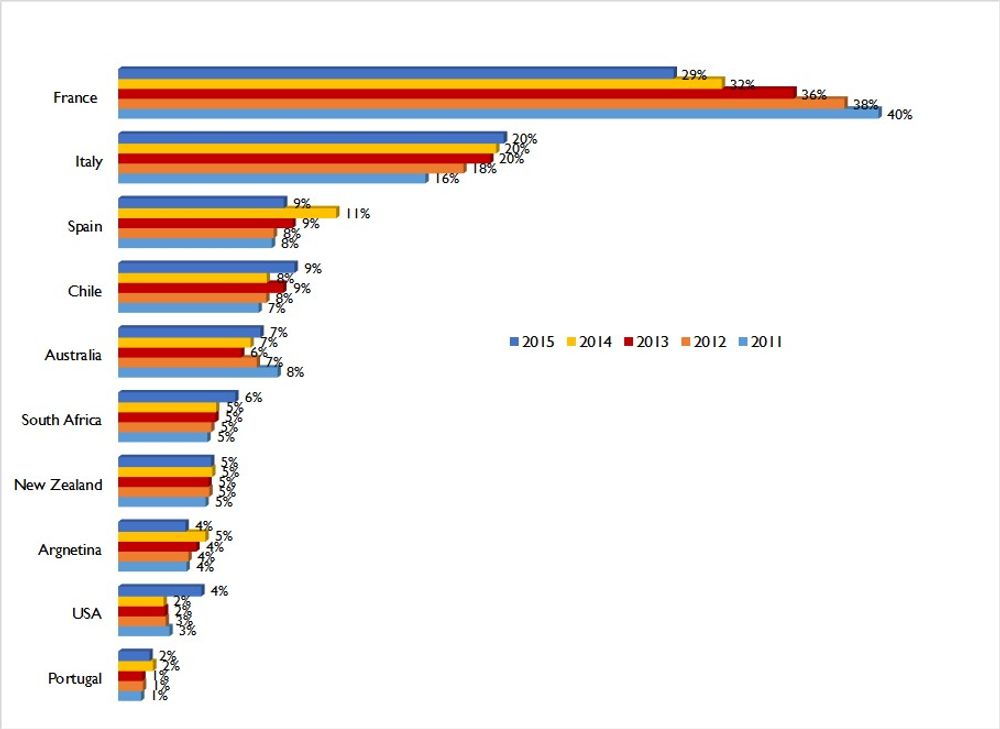
France’s declining share on UK wine lists can be clearly seen over the last five years
* You can buy the full Wine On-Premise UK report, which costs A$495 (around £250) by emailing peter@winebusinesssolutions.com.au. The report also includes
- who the best UK wine distributors are
- what the most listed wine brands and styles are
- what restaurants charge by the glass, bottle etc.
- how much wine business owners can expect to make from UK on-trade sales.